


Bitcoin ended July nearly 8.5% higher, recouping part of its 20.5% June decline as the largest cryptocurrency by market value followed one of its historically stronger seasonal patterns.
- Data from CoinGlass, a crypto data provider, shows that July has now produced gains in 10 of the 14 years covered by its dataset, a 71.4% success rate.
- Still, compounded monthly returns leave Bitcoin down roughly 27.5% in 2026 through July.
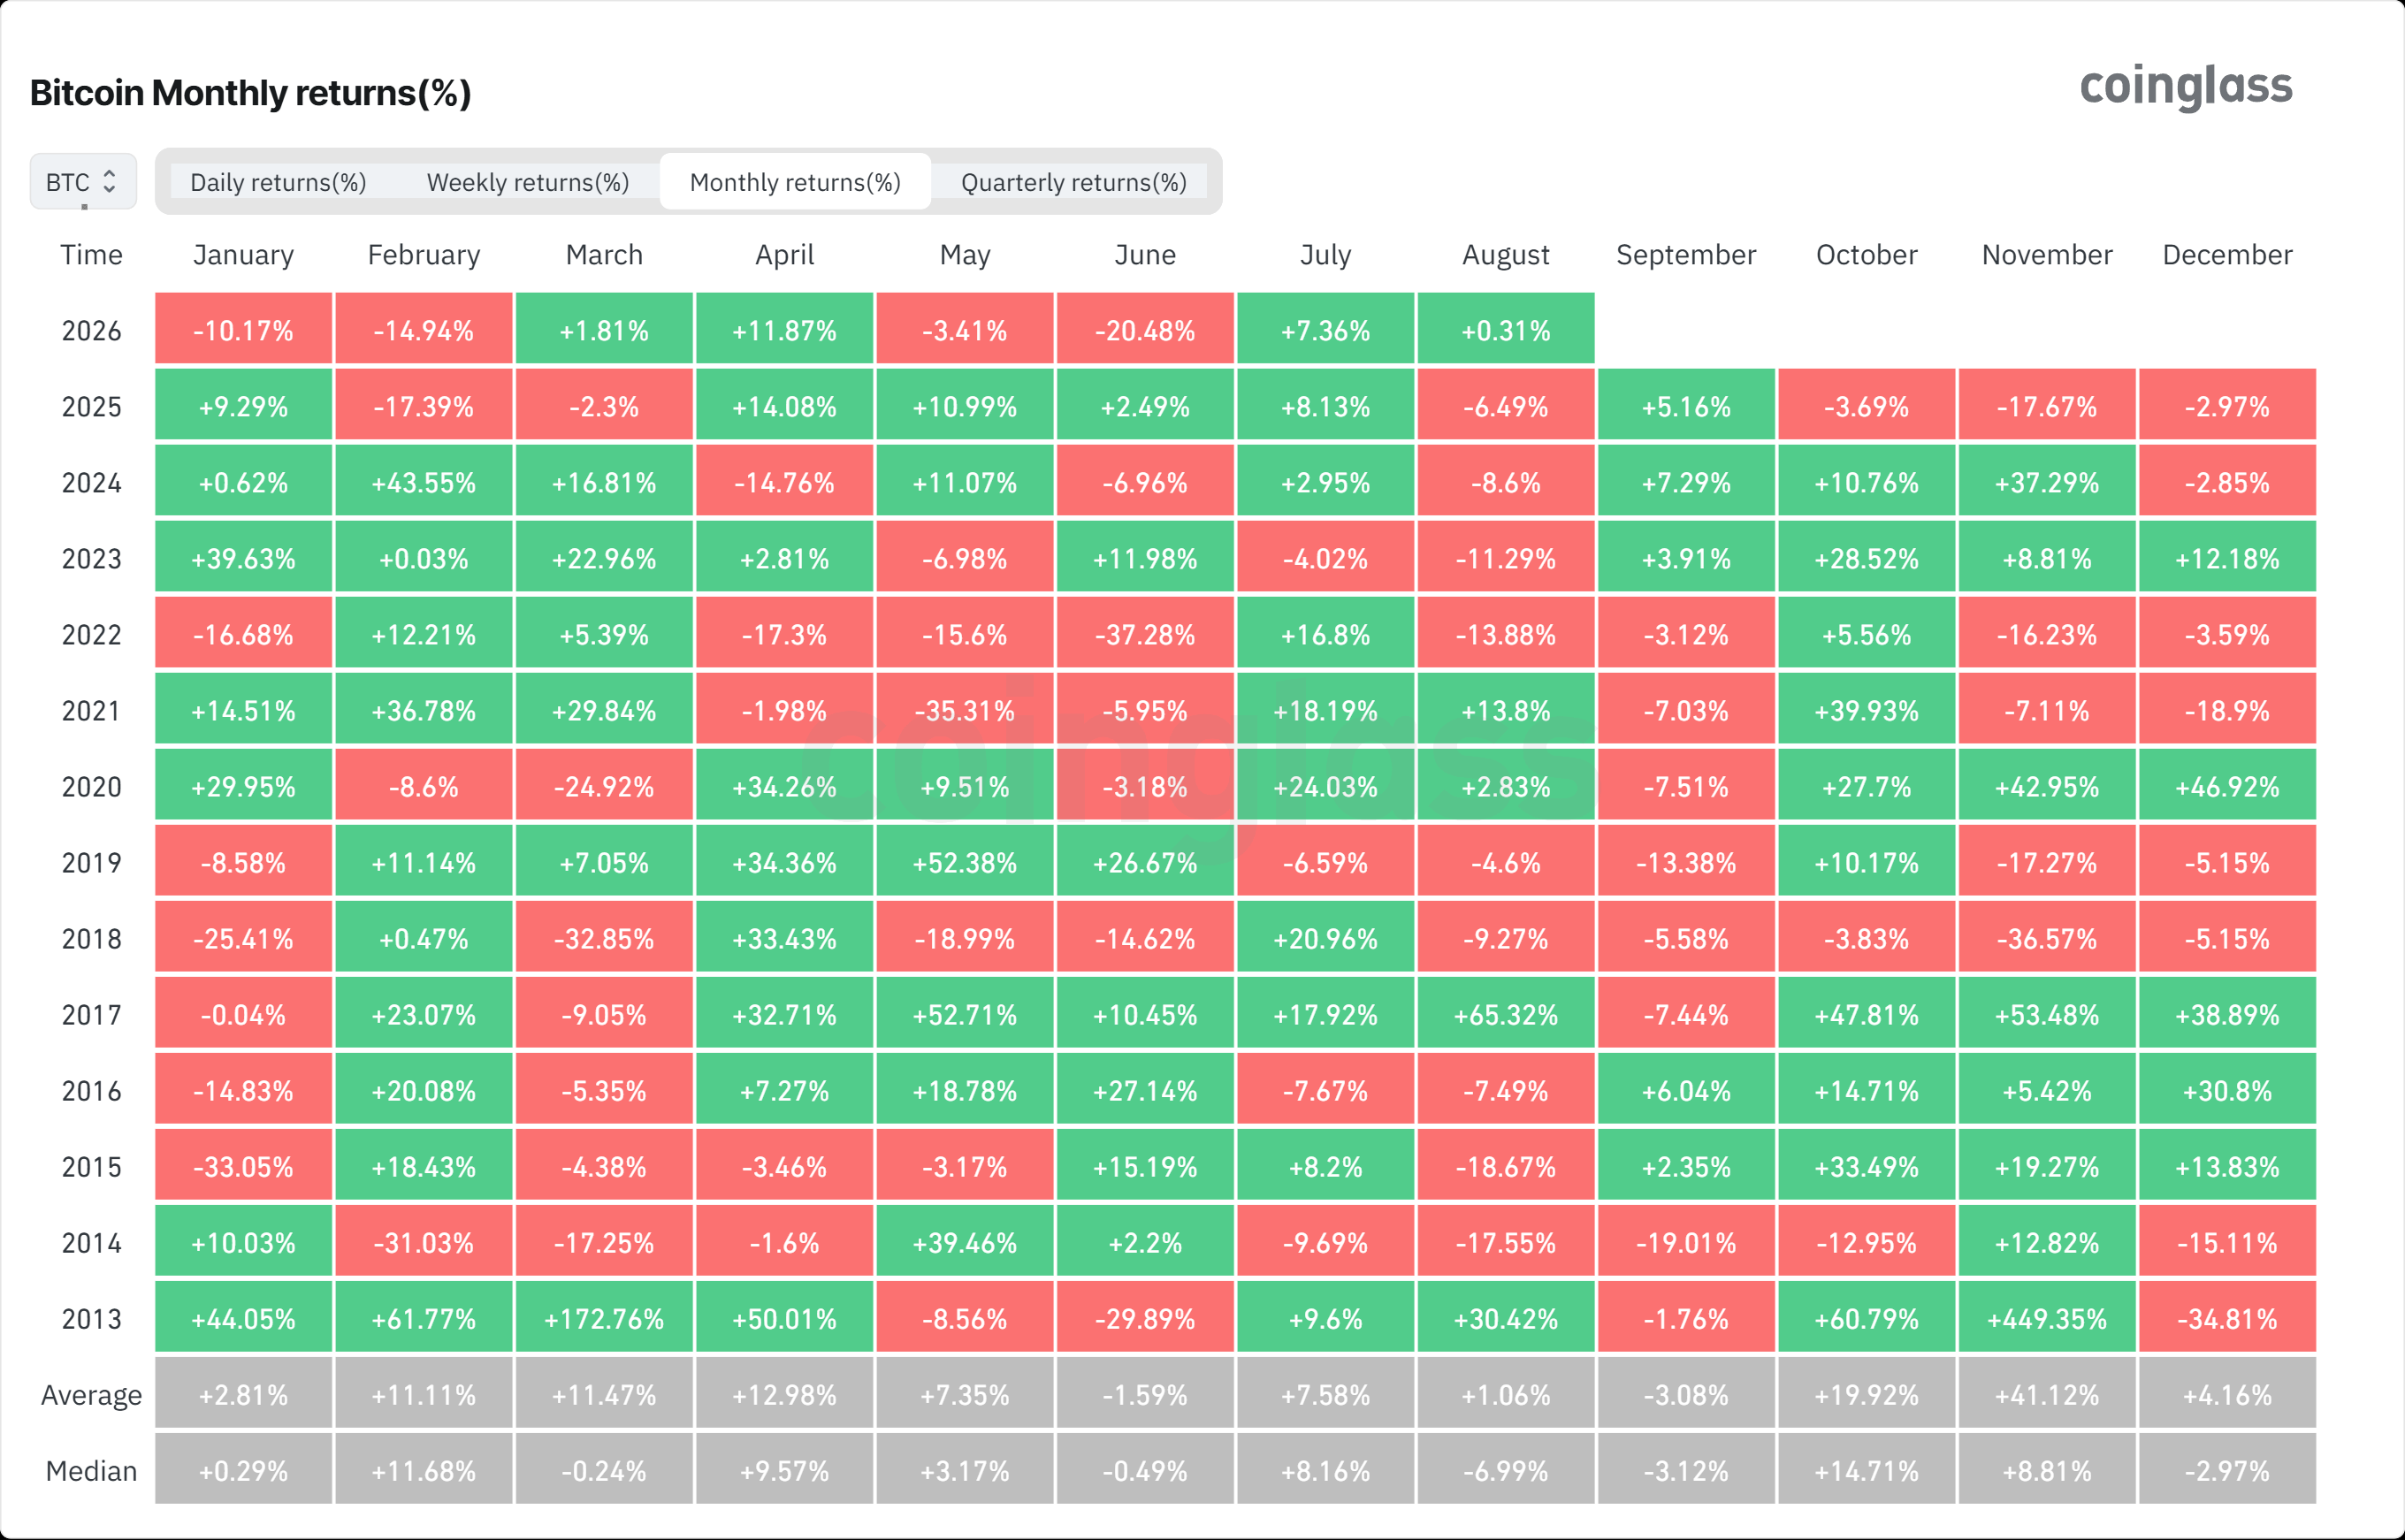
Bitcoin monthly returns. Source: CoinGlass
The record is far less favorable in August. Nine of the 13 Augusts from 2013 through 2025 ended lower, a 70% loss rate, while the median result was a 7.5% decline. Bitcoin has also fallen in August for four consecutive years.
A green July changes the record
However, The Coinformer's review of CoinGlass's year-by-year figures found that the bearish pattern weakens when the preceding month is considered.
- Bitcoin recorded nine positive Julys between 2013 and 2025. But only five were followed by an August decline.
- That reduces the historical loss rate to 55.6%, much closer to a coin toss than the widely cited 70%.
The picture looks even less bearish after particularly strong Julys. In the eight years when Bitcoin gained at least 8% in July, August split evenly between four gains and four losses.
The average return also looks much better than the hit rate suggests. Bitcoin has gained an average 1.1% in August despite most Augusts ending lower, largely because of two monster rallies: 65% in 2017 and 30% in 2013. Remove those two, and the average swings to a 7.4% loss.