


Bitwise says Bitcoin is moving less like U.S. stocks than at any point in more than a decade, but the firm says that finding applies to longer-term price trends rather than day-to-day market moves.
- Bitwise, the crypto asset manager, said in a Sept. 7 report that Bitcoin's 260-day correlation with the S&P 500 had fallen to its lowest level since 2015.
- Correlation is simply a way of measuring whether two assets tend to move together.
- A high positive reading means they generally rise and fall together, while a negative one means they increasingly move in opposite directions.
- The firm cautioned that such gains are unlikely to repeat, but said the current decoupling could still have "important implications" for diversified investors.
The catch is what Bitwise is measuring
The chart behind the claim is labeled "Bitcoin Correlation to SPX (log levels)." Rather than comparing how much Bitcoin and stocks rise or fall each day, the measure looks at whether their broader price paths have been moving together over roughly a year.
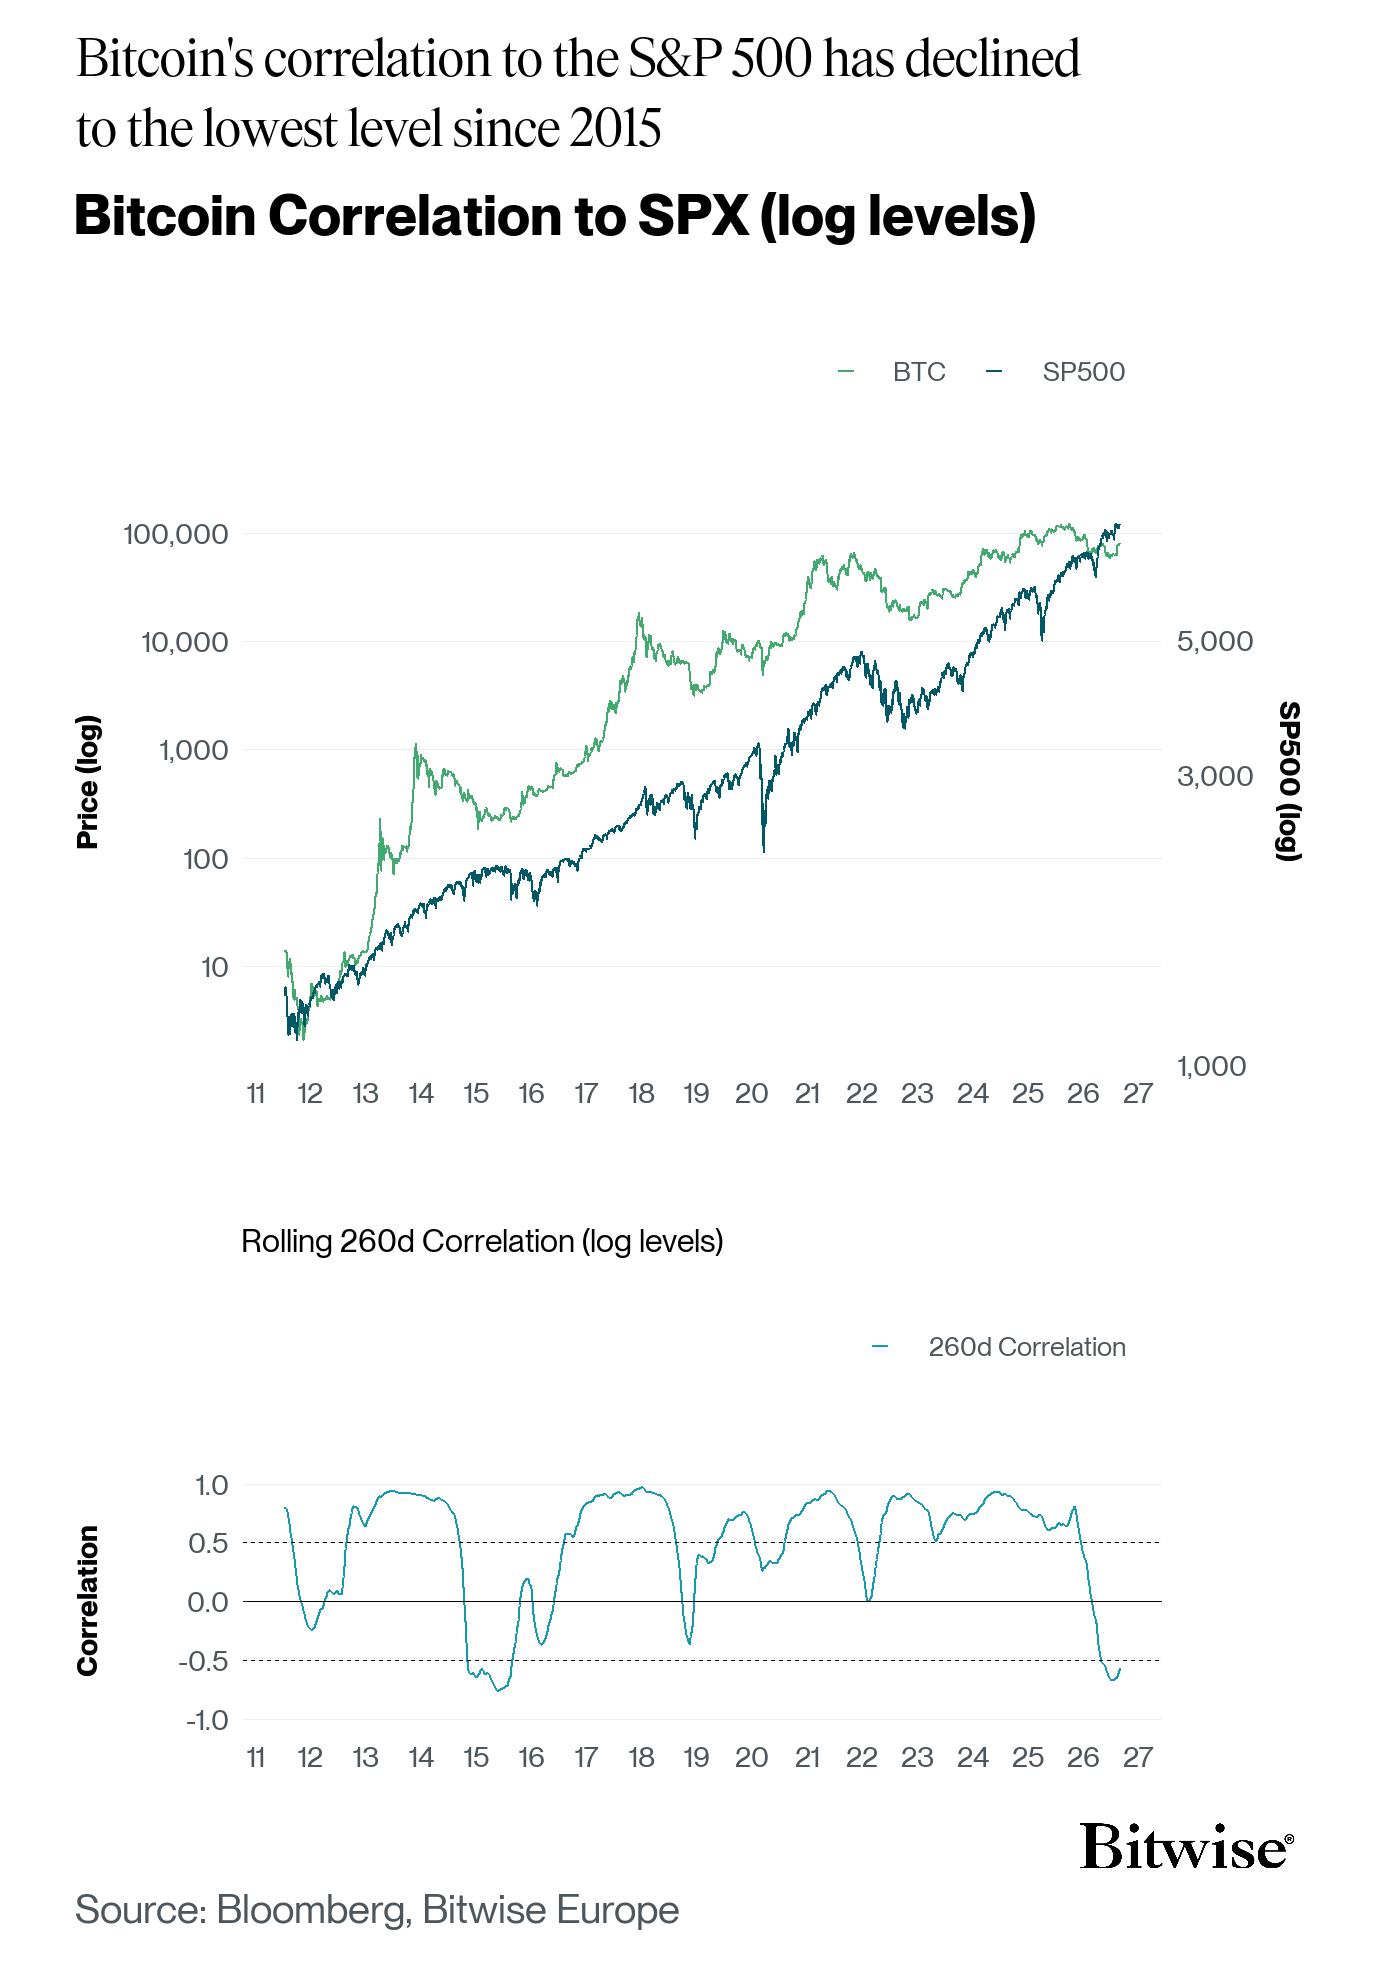
Bitcoin Correlation to SPX (log levels). Source: Bitwise
André Dragosch, Bitwise Europe's head of research, told The Coinformer that the distinction was deliberate.
André Dragosch
According to Dragosch, that makes the metric more appropriate for Bitwise's specific claim about Bitcoin "decoupling" from equities.
"Because 'decoupling' is a statement about trends, not about daily noise," he said.
Daily returns don't show the same break
Bitwise's decade-low reading doesn't show up in the same way when daily returns are measured over 260 days.
"You don't really see this in the correlation of daily returns on a 260-day rolling basis which is not as reactive. However, we have highlighted the decline in Bitcoin-stock correlation on a 3-months timeframe in our latest CIO Memo as well," Dragosch told The Coinformer.
Bitwise has, however, found a shorter-term drop in return-based correlation. In a Sept. 2 CIO memo, the firm said Bitcoin's three-month correlation with the Nasdaq 100 had fallen to a one-year low.
- A separate Sept. 3 analysis by LedgerTouch compared Bitcoin and S&P 500 weekly returns over 52 weeks and put the latest correlation at +0.376. Its lowest reading since 2014 was about -0.226 in 2019.
- Those figures aren't directly comparable because they use different timeframes, benchmarks and methods.
- Bitwise's "lowest since 2015" claim therefore refers to Bitcoin and the S&P 500's broader price paths, rather than their daily returns.